Incentives and Capital Engineering Engineered the Global Solar Boom
Financial and political math driving the global solar boom, examining how state-backed manufacturing subsidies, aggressive tax credits, and Chinese industrial overcapacity have simultaneously crashed solar hardware prices.
3 min read · Mexico City, Mexico
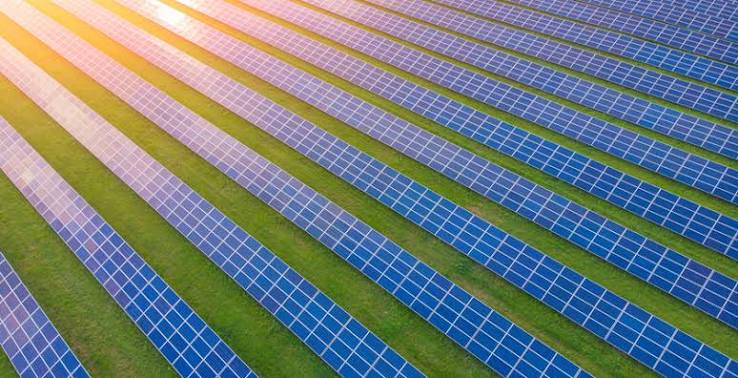
To look at a sprawling desert photovoltaic array or a dense canopy of rooftop panels glinting across suburban rooftops is to witness what looks like a pure triumph of free-market engineering. The cost of solar generation has plummeted by over 80% across the past decade, transforming solar panels from an elite, heavily subsidized novelty into the cheapest form of new electricity generation in human history.
Yet, scratch beneath the glossy corporate ESG reports and ribbon-cutting ceremonies, and you find a starkly different reality. The modern solar boom is not merely a testament to falling silicon prices; it is the direct product of an unprecedented, multi-hundred-billion-dollar state-engineered capital intervention.
The solar market runs on a specific mathematical equation: political capital in, financial risk mitigation out, and structural overcapacity guaranteed.
Layer 1: The Macro Subsidies and Capital Injection
The global acceleration of solar deployment—which shattered previous records with over 510 gigawatts added globally in a single recent cycle—has been aggressively backstopped by state-level industrial policy.
In North America, the architecture of this boom rests heavily on provisions like the U.S. Inflation Reduction Act (IRA), which fundamentally altered project economics by shifting from temporary tax credits to long-term, transferable production and investment tax credits (PTCs and ITCs).
The Manufacturing Adder: Under current federal frameworks, domestic solar module assemblers and cell manufacturers receive production tax credits of roughly 3 to 7 cents per watt. For a utility-scale 500-megawatt manufacturing line, this translates into tens of millions of dollars annually in direct federal subsidy support, effectively derisking operational overhead.
The Co-Location Surge: Market intelligence from groups like BloombergNEF highlights that global renewable energy investment has increasingly favored co-located solar and storage assets—capturing a record pace of capital allocation as developers leverage tax-credit stacking to offset the high capital expenditure of battery integration. BloombergNEF
Estimated Global Solar Capacity vs. State-Subsidized Capital Inflow
---------------------------------------------------------------------------------
Year / Period Global Annual Additions Estimated Global Clean Energy Capital
---------------------------------------------------------------------------------
2023 ~440 GW ~$1.77 Trillion
2024 ~480 GW ~$2.02 Trillion
2025 ~510 GW (Record peak) ~$2.15 Trillion
2026 (Projected) ~490 - 500 GW ~Plateauing / Policy Transition Phase
---------------------------------------------------------------------------------
*(Sources: Compiled from International Renewable Energy Agency, BloombergNEF trackers, and International Energy Agency deployment metrics.)*
Layer 2: The Overcapacity Paradox
While Western nations deployed massive financial incentives to jump-start domestic manufacturing supply chains, China executed a parallel, state-backed industrial strategy on an entirely different scale.
By aggressively subsidizing raw polysilicon production, ingot slicing, and wafer fabrication through provincial energy subsidies, cheap state-directed loans, and municipal land grants, Chinese manufacturers captured over 80% of the global solar supply chain.
The resulting economic math created a profound global paradox:
The Price Collapse: State-backed overcapacity drove solar photovoltaic module spot prices down to historic lows (hovering near 10 to 12 cents per watt), making solar installations economically irresistible for grid operators worldwide.
The Margin Squeeze: Paradoxically, these hyper-low module prices crippled Western component manufacturers. Even with heavy domestic subsidies like the IRA’s manufacturing tax credits, U.S. and European startups struggled to compete against low-cost imported panels, forcing widespread requests for tariff protections and anti-dumping duties. The subsidy intended to build local factories often found itself fighting a losing battle against a tidal wave of subsidized overproduction from abroad.
Layer 3: The Interconnection and Grid Subsidy Barrier
The final equation of the solar boom is hidden in plain sight: the cost of connecting to the grid.
While building a solar farm has become cheap and heavily subsidized, getting that power to a population center requires navigating a congested transmission queue. In the U.S. and parts of Europe, transmission queues are bloated with gigawatts of solar projects sitting idle for years, waiting for regional transmission organizations (RTOs) to build out high-voltage lines.
To bypass this bottleneck, institutional capital has pivoted heavily toward co-located solar-plus-storage, where batteries capture excess midday generation to feed the grid during evening peaks, avoiding costly transmission upgrades.
The Bottom Line: Can the Math Last?
The solar boom is real, irreversible, and fundamentally reshaping global energy geopolitics. But it is important to be clear-eyed about its mechanics. The industry did not conquer fossil fuels purely through organic market efficiency; it succeeded because governments across the globe decided that underwriting the energy transition was a matter of national security and industrial survival.
As central banks adjust interest rates and fiscal constraints tighten across major economies, the second wave of the solar boom will test whether the technology can stand entirely on its own economic merits—or if it will remain permanently tethered to the state ledger.
Business and climate correspondent covering how economic policy shapes the energy transition.
Comments (0)
Comments are turned off for this story.